Mastering Sales Success: Why Leading Indicators and KPIs are the Compass for Future Revenue

The conventional reliance on closed deals as the sole barometer for sales success is a perilous oversight, akin to navigating a ship by constantly looking at its wake. While final sales figures provide a clear record of past performance, they are inherently lagging indicators—data that reveals what has already transpired, often too late for meaningful intervention. A more strategic and proactive approach demands a pivot towards leading indicators: Key Performance Indicators (KPIs) and metrics that offer predictive insights into future revenue streams, enabling sales leaders to anticipate challenges and steer their teams toward sustained growth.
The antiquated practice of scrutinizing only closed business—the final transaction—leaves organizations vulnerable to sudden downturns. If current sales figures are dismal, it typically signifies a systemic issue that began months prior, deep within the sales pipeline. By the time a revenue drought becomes apparent, the business may already be in a critical state, facing significant financial strain and, in some cases, reaching a point of no return where corrective actions are severely limited or ineffective. This reactive stance hinders strategic planning, resource allocation, and overall business stability. Modern sales leadership necessitates the cultivation of a forward-looking perspective, identifying and tracking the behaviors and metrics today that are indispensable for securing sales tomorrow.
The Paradigm Shift: From Reactive Reporting to Proactive Forecasting
The imperative to move beyond mere reporting of past sales stems from the dynamic and increasingly competitive nature of today’s markets. Businesses can no longer afford to operate with a retrospective view; agility and foresight are paramount. The financial implications of a sudden drop in sales can be catastrophic, impacting everything from cash flow and investment capacity to employee morale and market valuation. For publicly traded companies, a significant miss on quarterly revenue targets can trigger a sharp decline in stock price, eroding investor confidence built over years. Internally, it can lead to layoffs, budget cuts, and a pervasive sense of uncertainty.
This realization has spurred a paradigm shift in sales management, moving from a reactive, outcome-focused model to a proactive, process-driven one. The core of this transformation lies in the intelligent application of Key Performance Indicators (KPIs). These are not merely data points but critical navigational tools, providing an objective and quantifiable lens into the health and trajectory of the sales operation. By tracking the right KPIs, sales leaders gain an invaluable glimpse into their future pipeline, allowing them to identify potential roadblocks or emerging opportunities long before they materialize into revenue shortfalls or windfalls. This early detection capability empowers them to implement timely adjustments, reallocate resources, provide targeted coaching, and ultimately, change the direction of their sales outcomes.
Differentiating Sales Pipeline and Sales Forecast for Precision
A foundational step in establishing an effective KPI framework is to clearly differentiate between a sales pipeline and a sales forecast—two terms frequently conflated within sales departments. A sales pipeline offers a comprehensive overview of all active opportunities, regardless of their current probability of closing. It encompasses every lead, prospect, and proposal at various stages of engagement, providing a complete landscape of potential business. This holistic view is crucial for understanding the overall market engagement and the volume of potential deals.
Conversely, a sales forecast represents a more refined subset of the pipeline. It specifically includes only those qualified opportunities that are deemed highly likely to close within a defined reporting period, such as a quarter or a fiscal year. This narrower focus is essential for accurate financial planning, budgeting, and resource allocation. A robustly defined pipeline, segmented into clear, actionable stages, serves as the backbone for organizing the sales process, establishing benchmarks, and creating effective tools for the sales team. This structural clarity significantly enhances the ability to predict the future success of the sales force. When KPIs are meticulously applied to both the pipeline and the forecast, it becomes possible to achieve remarkable forecast accuracy, often within a 5% margin of error. Such precision provides continuous insight into team performance and forewarns of any impending challenges, allowing for strategic pre-emption.
The sales forecast, therefore, acts as a forward-planning instrument for executive decision-making, influencing budgets, spending, and strategic investments. By integrating KPIs around lead conversion success, such as the cost per qualified lead or the conversion rate from MQL to SQL, organizations can budget more effectively, optimize marketing spend, and predict revenues with greater confidence. This dual understanding of pipeline and forecast, supported by relevant KPIs, forms the bedrock of a predictable and sustainable sales engine.
The Essential KPIs for Comprehensive Sales Management
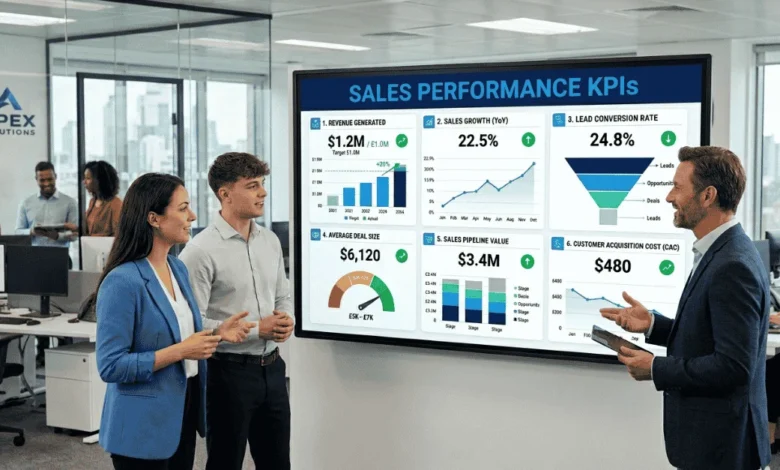
To ensure a holistic and predictive view of sales performance, sales managers should focus on three primary categories of KPIs: Funnel Development, Revenue and Quota Attainment, and Account Management and Client Retention. Each category addresses a distinct phase of the customer journey and provides unique insights into the health of the sales operation.
1. KPIs for Funnel Development and Prospecting Efficiency:
The initial stages of the sales funnel, particularly prospecting and lead qualification, are critical leading indicators. The volume and quality of activity at this stage directly correlate with future closed deals. Effective measurement here goes beyond simply counting the first dial; it involves tracking every touchpoint required to engage a decision-maker.
- Number of New Leads Generated: This metric tracks the sheer volume of potential customers entering the pipeline. It’s a foundational measure of marketing and initial outreach effectiveness.
- Lead Quality/Qualification Rate: Moving beyond quantity, this KPI assesses the percentage of raw leads that meet predefined criteria to become Marketing Qualified Leads (MQLs) or Sales Qualified Leads (SQLs). A high qualification rate indicates efficient lead generation and targeting.
- Conversion Rates (Stage-to-Stage): Crucial for identifying bottlenecks, this tracks the percentage of opportunities that successfully move from one stage of the sales pipeline to the next (e.g., Prospect to Qualified Lead, Qualified Lead to Proposal, Proposal to Negotiation). Anomalies here highlight areas for coaching or process improvement. For instance, an industry average conversion rate from initial contact to qualified lead might be around 10-15%, but this can vary significantly by industry and product complexity.
- Sales Cycle Length (Overall and Per Stage): This KPI measures the average time it takes for a deal to progress from initial contact to close. A prolonged sales cycle can indicate inefficiencies, lack of urgency, or issues with follow-up. Monitoring length per stage helps pinpoint exactly where delays occur. For example, if the average sales cycle for a B2B SaaS product is 90 days, but a specific stage, like "proposal presented," consistently takes 40 days, it signals a need for intervention.
- Number of New Client Meetings/Demos Booked: A direct measure of proactive engagement and pipeline activity, indicating future opportunities.
- Outbound Activity Metrics: This includes the number of calls made, emails sent, social selling interactions, and voicemails left. While not directly revenue-generating, these activities are foundational leading indicators of future engagement.
- Lead Source Effectiveness: Identifying which channels (e.g., inbound marketing, referrals, cold outreach) generate the highest quality leads and conversion rates allows for optimized marketing and sales resource allocation.
Crucially, deals often stall between stages due to insufficient follow-up. Implementing structured follow-up strategies and tracking their execution through KPIs can significantly improve pipeline velocity. Studies suggest that consistent, value-driven follow-up can increase conversion rates by 20-30%.
2. KPIs for Revenue and Quota Attainment:
These metrics directly link sales activities to financial outcomes and provide insight into the efficiency of closing deals and overall revenue generation.
- Average Deal Size/Average Contract Value (ACV): This measures the typical revenue generated per closed deal. Understanding ACV helps in forecasting, setting appropriate quotas, and identifying opportunities for upselling or cross-selling.
- Win Rate/Close Rate: The percentage of proposals or opportunities that result in a closed deal. This is a critical indicator of sales effectiveness, product-market fit, and competitive positioning. An industry benchmark might be 20-30%, but top performers can exceed 50%.
- Proposal-to-Close Ratio: Similar to win rate, but specifically focused on opportunities that have reached the proposal stage. It assesses the effectiveness of the sales team in converting late-stage opportunities.
- Quota Attainment Percentage: This measures how much of their assigned revenue target a salesperson or team has achieved. It’s a direct indicator of performance against financial goals.
- Sales Velocity: This metric combines deal size, win rate, and sales cycle length to measure how quickly value is moving through the pipeline. A higher sales velocity indicates a more efficient and productive sales process.
- New vs. Existing Client Sales: Differentiating revenue from new client acquisition versus expansion within existing accounts helps in understanding growth strategies and resource allocation.
3. KPIs for Account Management and Client Retention/Growth:
Long-term business success is heavily dependent on customer loyalty and expansion. These KPIs focus on the post-sale relationship and its impact on sustainable revenue.
- Client Retention Rate: The percentage of existing clients retained over a specific period. High retention is crucial for predictable recurring revenue and indicates customer satisfaction and value delivery. Losing a customer is significantly more expensive than retaining one, with acquisition costs often 5-25 times higher than retention costs.
- Average Client Growth (Year-over-Year): This measures the revenue increase from existing client accounts through upsells, cross-sells, or contract expansions. It reflects the effectiveness of account managers in nurturing and growing relationships.
- Customer Lifetime Value (CLTV): The predicted total revenue a business can expect from a customer throughout their relationship. This metric underscores the long-term value of customer retention and growth.
- Churn Rate: The percentage of customers who stop doing business with a company over a given period. A high churn rate is a critical red flag indicating underlying issues with product, service, or customer experience.
- Net Promoter Score (NPS) or Customer Satisfaction (CSAT): While not direct revenue metrics, these qualitative indicators provide crucial insights into customer sentiment, which directly impacts retention, referrals, and future growth.
Depending on the specific industry and business model, additional KPIs might be relevant. For instance, a staffing firm might track "positions filled per recruiter," a SaaS company might monitor "average contract value (ACV)" or "monthly recurring revenue (MRR) per customer," and an e-commerce business would closely watch "average order value" and "customer repeat purchase rate." The key is to select metrics that are directly actionable and reflect the unique drivers of success for that particular business.
Establishing Benchmarks and Operationalizing KPI Review
The utility of any KPI lies not just in its measurement, but in its context. Each KPI must be accompanied by an appropriate benchmark, derived from either the company’s historical sales data or, for new ventures, industry averages. A thorough review of prior years’ or quarters’ sales performance can help in calculating realistic averages, setting ambitious yet attainable quotas, and identifying historical trends. For example, understanding the average deal size and combining it with the lead-to-close conversion rate provides a scientific and objective method for determining the number of opportunities required in the pipeline to achieve specific revenue targets. This data-driven approach removes much of the guesswork from sales planning.
However, even the most meticulously chosen KPIs are useless if they are not actively monitored and acted upon. The optimal frequency for reviewing sales data is weekly. This consistent rhythm allows sales leaders to identify trends—both positive and negative—early enough to react appropriately. A sudden dip in qualified leads, a slowdown in stage-to-stage conversions, or an increase in sales cycle length can be spotted and addressed before they cascade into a missed forecast. Conversely, an uptick in specific metrics can inform best practices to be replicated across the team.
Integrating technology like Customer Relationship Management (CRM) systems with robust sales analytics dashboards is crucial for automating data collection and visualization. These tools provide real-time insights, allowing for immediate analysis and decision-making. If an organization lacks the internal capacity or experience to manage this weekly rhythm effectively, engaging a fractional sales leader can bridge this gap, providing expert oversight and strategic guidance without the overhead of a full-time executive.
Empowering the Sales Team Through Transparency and Coaching
The implementation of a KPI framework should not be a top-down mandate but a collaborative process that includes the sales team. Involving sales representatives in understanding and tracking their individual KPIs fosters a sense of ownership and accountability. Regular, ideally weekly, coaching sessions where each person’s KPIs are reviewed are invaluable. These sessions serve multiple purposes: they reinforce the importance of specific behaviors that drive sales, allow for early identification of performance lags, and provide opportunities for targeted coaching and skill development. For instance, if a rep’s "proposal-to-close" ratio is consistently below the team average, the coaching session can focus on proposal presentation skills, objection handling, or negotiation tactics.
Such transparency demystifies the sales process, moving away from subjective evaluations to objective, data-driven performance management. It helps individual reps understand the direct correlation between their daily activities and their future success, motivating them to focus on high-impact behaviors. This proactive coaching model is a significant departure from waiting until the end of a quarter to address missed targets, which often leaves reps feeling blindsided and demoralized.
The Broader Implications: Strategic Foresight and Sustainable Growth
Adopting a clear, data-driven KPI framework for sales management offers profound strategic advantages that extend far beyond simply hitting sales targets.
- Enhanced Forecasting Accuracy: The ability to predict future revenue with a high degree of accuracy transforms financial planning, allowing for more informed decisions regarding investments, hiring, and expansion. It provides financial stakeholders with greater confidence and stability.
- Proactive Problem Solving: By identifying issues in the pipeline early, sales leaders can shift from crisis management to strategic intervention. This means addressing skill gaps, reallocating leads, or refining sales messaging before problems become critical, safeguarding revenue streams.
- Improved Sales Coaching and Development: KPIs offer a clear roadmap for individual and team development. They highlight specific areas where coaching is needed, making training more effective and personalized. This leads to a more skilled, confident, and productive sales force.
- Optimized Sales Process: Continuous monitoring of stage-to-stage conversion rates and sales cycle lengths enables ongoing refinement of the sales process. Bottlenecks can be removed, inefficient steps streamlined, and best practices identified and institutionalized, leading to greater operational efficiency.
- Sustainable Growth and Competitive Edge: Businesses that leverage leading indicators to build a predictable revenue engine are better positioned for sustainable, long-term growth. This data-driven approach fosters a culture of continuous improvement, making the organization more agile and resilient in the face of market changes, ultimately providing a significant competitive advantage.
- Better Resource Allocation: Understanding which activities and channels yield the best results allows for more strategic allocation of sales and marketing resources, maximizing ROI and minimizing waste.
In essence, a well-implemented KPI strategy empowers sales leaders to transform uncertainty into strategic foresight. It provides an unparalleled opportunity not just to predict the future course of sales but to actively shape it. By embracing leading indicators, organizations can move beyond the limitations of hindsight, building robust, resilient, and predictably successful sales operations that drive consistent revenue growth and long-term profitability. The era of being blindsided by poor sales performance is obsolete; with the right KPIs, the future of sales is visible, measurable, and, most importantly, actionable.
Related posts: