
Mastering E-commerce Analytics: A Strategic Guide to Data-Driven Growth for WooCommerce Store Owners


The modern digital marketplace operates on a foundation of data, yet for many independent merchants, the sheer volume of information can be overwhelming. Transitioning from reactive store management to a proactive, data-driven model is no longer a luxury but a fundamental requirement for scaling an online business. By leveraging the data already flowing through your WooCommerce store, you can move beyond simple observation and begin to make informed decisions regarding inventory, customer retention, and marketing expenditure.

The Evolution of E-commerce Intelligence
Historically, small business owners relied on intuition or basic bookkeeping to track performance. Today, the integration of sophisticated analytics tools has democratized access to enterprise-level insights. WooCommerce, as one of the world’s most widely used e-commerce platforms, provides a robust native reporting framework designed to bridge the gap between raw transaction logs and actionable business intelligence.
The process of effective data analysis should always begin with a defined objective. Rather than indiscriminately monitoring every metric, store owners should identify the specific questions that govern their business health. Are sales figures trending upward or downward? Which product categories demonstrate the highest repeat purchase rates? Has a recent marketing campaign successfully converted new demographics? By framing these inquiries before accessing data, merchants can navigate the platform’s reporting modules with purpose, ensuring that every insight is tied to a potential business outcome.

Decoding Core Sales Metrics
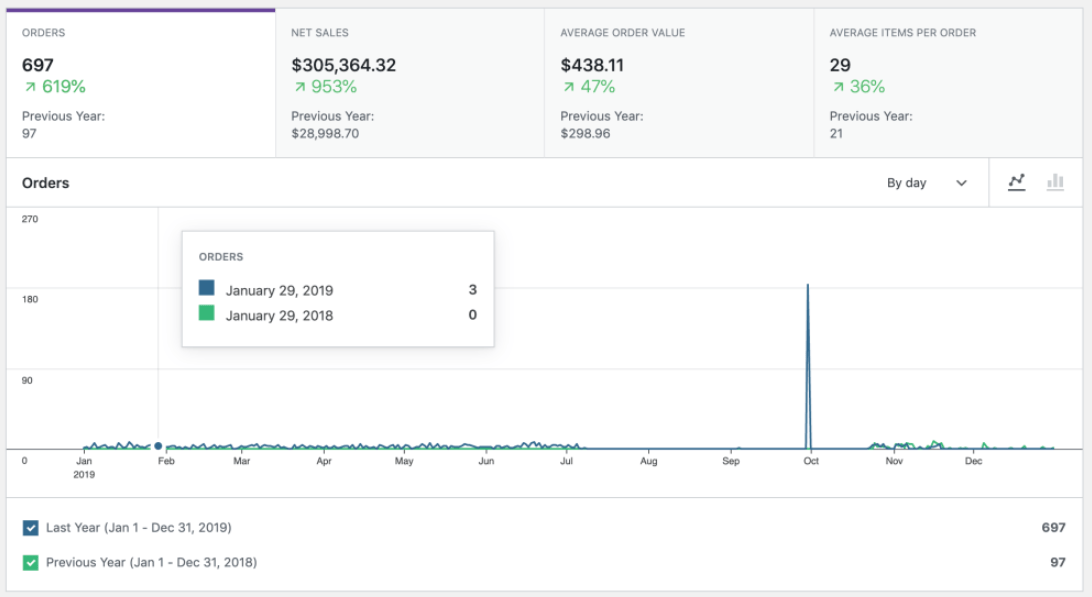
At the heart of store performance analysis lie the Orders and Products reports. These tools serve as the primary diagnostic mechanism for understanding revenue drivers. The Orders report offers a longitudinal view of sales performance, allowing merchants to compare real-time data against historical benchmarks.
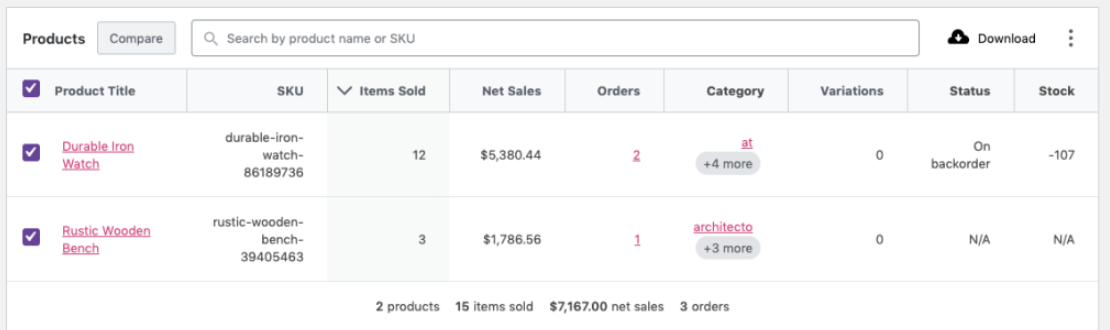
A common pitfall for emerging businesses is conflating order volume with total revenue. For instance, a store might experience a 25% increase in transaction volume while net sales remain stagnant. This discrepancy, often resulting from lower average order values (AOV) or aggressive discounting, serves as a vital indicator of shifting consumer behavior. By segmenting data via the Products report, merchants can determine whether this stagnation is due to a shift in product mix—such as a decline in premium product sales—or an overall decrease in purchasing power. Analyzing these trends month-over-month allows for the fine-tuning of pricing strategies and promotional efforts to ensure that volume growth translates into meaningful bottom-line improvements.
Investigating Revenue Leaks and Operational Efficiency
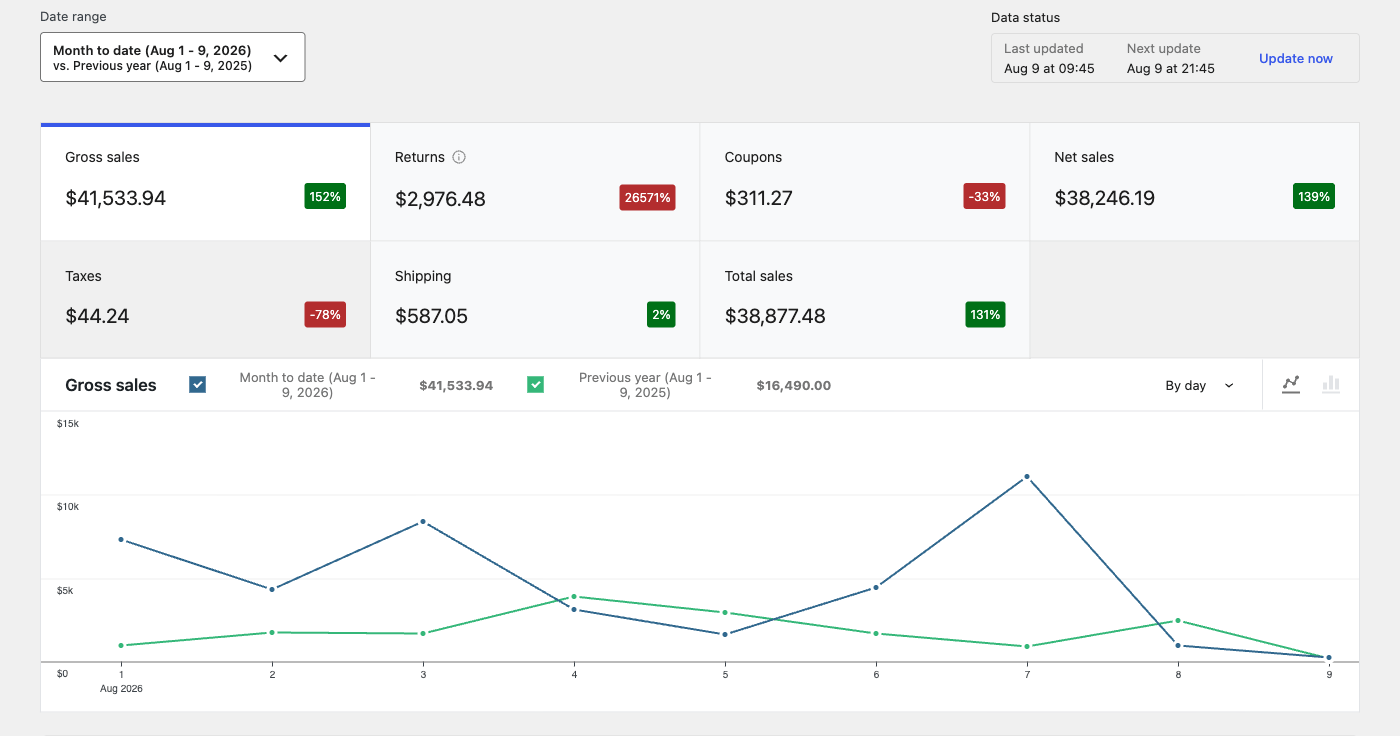
Profitability is rarely determined by gross sales alone. The Revenue report provides a granular look at the impact of refunds and coupons, both of which can significantly erode profit margins if left unchecked. A rising trend in coupon usage may indicate a need for a more sustainable acquisition strategy, while an uptick in refunds serves as a critical warning sign regarding product quality or fulfillment consistency.
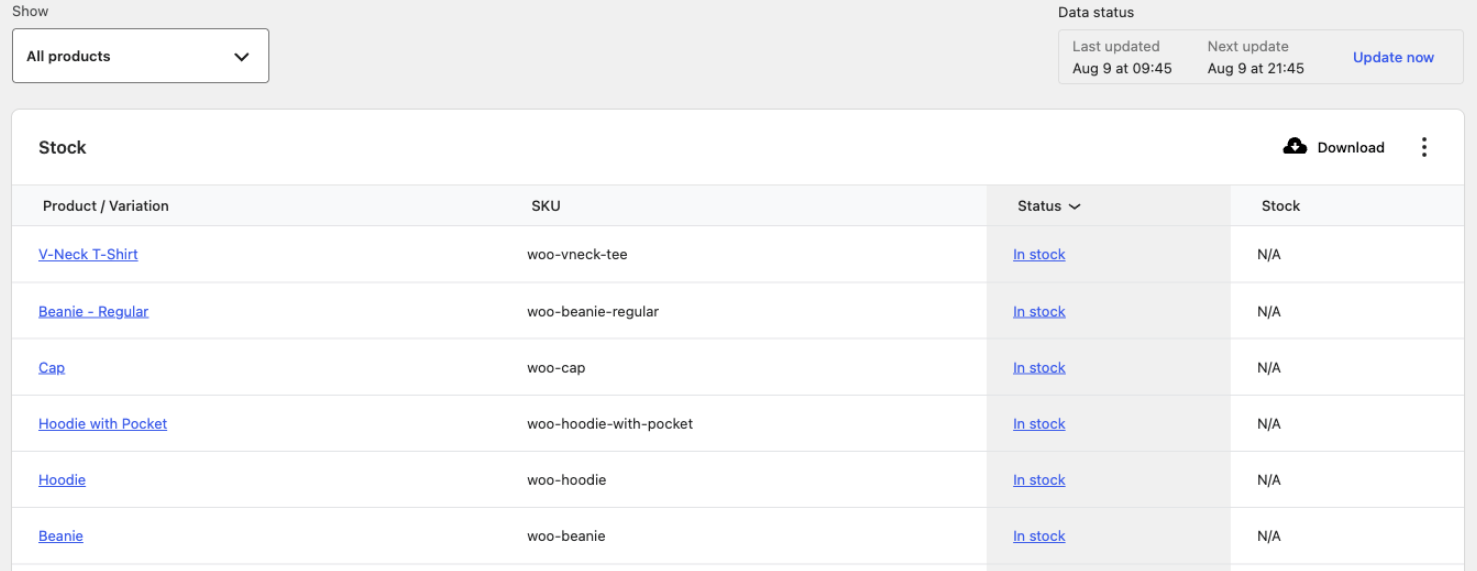
By utilizing the Coupons report to track which promotional codes correlate with the highest customer lifetime value, store owners can move away from blanket discounting and toward more targeted, profitable incentives. Simultaneously, the Stock report acts as a bridge between financial performance and logistics. Aligning stock replenishment schedules with sales velocity—ensuring that high-demand items are prioritized in procurement—minimizes the capital tied up in slow-moving inventory and prevents the lost revenue associated with out-of-stock events.
Customer Segmentation and Behavioral Insights
The ability to categorize customers into distinct cohorts is perhaps the most powerful application of the Customers report. By analyzing data on repeat purchase rates, location, and spending habits, merchants can create personalized experiences that resonate with specific demographics. For example, a segment of customers who demonstrate high frequency but low AOV may be ideal candidates for product bundling, whereas high-spenders might be better served by exclusive loyalty programs or early access to new releases.
These patterns enable a transition from generic mass marketing to a precision-based approach. When data suggests that a specific region or customer type is underperforming, the merchant can pivot resources to address that specific segment rather than applying a blanket change to the entire store.
Multi-Channel Attribution and Web Behavior
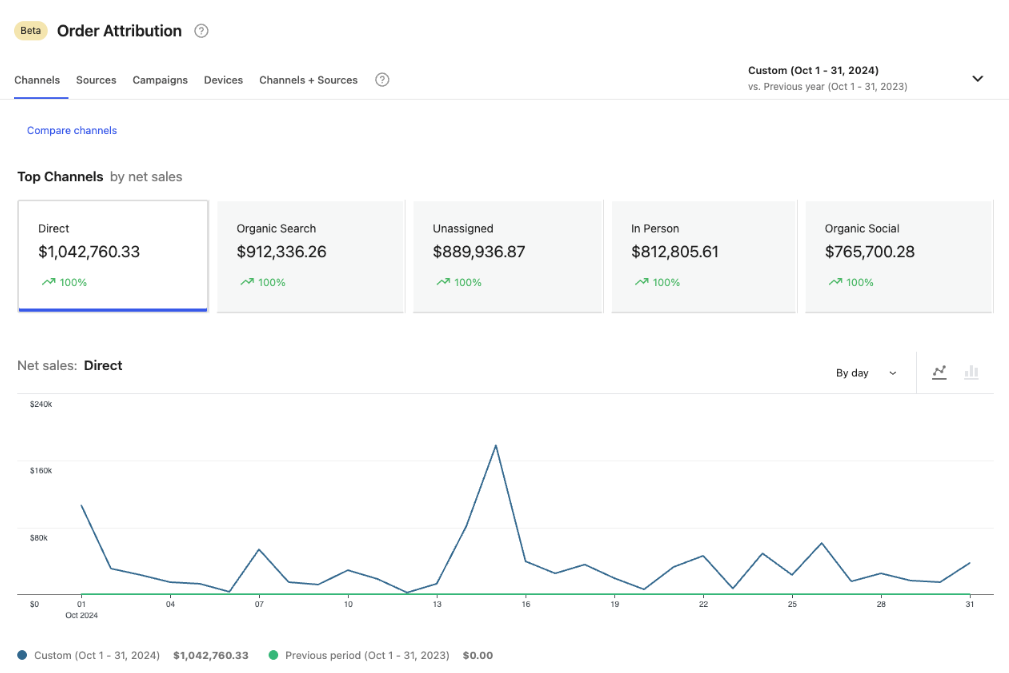
While internal WooCommerce reports provide the foundation, connecting with external platforms such as Google Analytics 4 (GA4) offers a broader view of the customer journey. The integration between WooCommerce and GA4 is essential for understanding the "why" behind the numbers. If the Products report highlights a decline in a bestseller’s performance, GA4 can clarify whether that decline is due to a lack of traffic or a failure to convert visitors at the checkout stage.
This distinction is crucial for resource allocation. If traffic is high but conversion is low, the focus must shift to User Experience (UX) and site performance. If traffic is low, the focus shifts to marketing acquisition channels. Utilizing the Purchase Journey report within GA4 allows merchants to map the path from initial product view to final purchase, revealing friction points that may be causing cart abandonment. It is important to note that due to privacy regulations and consent management, data discrepancies between WooCommerce and GA4 are expected; therefore, WooCommerce should remain the primary source of truth for absolute sales figures.
Advanced Tooling and Scalability
As a business matures, the complexity of its data requirements grows accordingly. Specialized extensions, such as those designed for subscription-based models, offer deep dives into recurring revenue, churn rates, and renewal cycles. Similarly, tools that track the Cost of Goods Sold (COGS) provide a more accurate picture of profitability by allowing merchants to subtract the actual cost of inventory from revenue.
For high-volume retailers or those operating across multiple storefronts, consolidated analytics platforms like Metorik provide a centralized dashboard. These platforms aggregate disparate data points—including customer lifetime value (CLV), cohort analysis, and predictive forecasting—into a single interface. While these advanced tools represent an additional overhead, their ability to save time and provide high-level strategic oversight often justifies the investment as the business scales.
Strategic Framework for Implementation
To prevent "analysis paralysis," merchants should adopt a phased approach to data implementation:
- Prioritize Questions: Define the most pressing business challenge (e.g., "Why are customers dropping off at checkout?") before opening any reporting tool.
- Utilize Native Reporting: Begin with the built-in WooCommerce Overview and standard reports to establish a baseline of performance.
- Integrate Behavioral Data: Connect GA4 to gain insights into how users navigate the site before they reach the purchase phase.
- Scale with Precision: Only invest in additional analytics extensions or platforms when specific, unanswered questions require more specialized diagnostic capabilities.
The objective of this framework is to foster a culture of evidence-based decision-making. By regularly reviewing the "Big Picture" in the WooCommerce dashboard and drilling down into specific reports when necessary, store owners can transform data from a overwhelming stream of numbers into a strategic roadmap for growth. In an era where market conditions shift rapidly, the ability to interpret these signals accurately is the most significant competitive advantage an online retailer can possess.