A New Era of Customizable Reporting
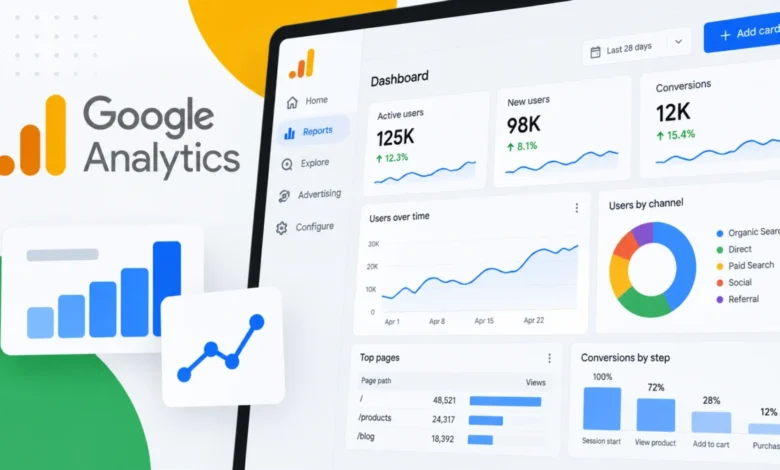
For years, digital marketers and data analysts have relied on Google Analytics to track complex user behaviors, often finding themselves navigating through multiple standard reports to build a comprehensive picture of business health. The introduction of Dashboards fundamentally changes this workflow. The new feature utilizes a grid-based canvas, allowing users to manually position, resize, and align visualizations to match their specific organizational needs.
Rather than relying on static, pre-configured reports, users can now drag dimensions and metrics directly onto the canvas. This democratization of report building enables teams to create bespoke performance dashboards that reflect the unique KPIs of their specific business models—whether they are e-commerce platforms tracking conversion funnels or content sites monitoring engagement duration.
Technical Specifications and Visualization Capabilities
At the time of launch, Google has integrated six distinct visualization types designed to cover the most critical analytical requirements:
- Scorecards: Ideal for high-level KPIs, these cards provide immediate visibility into core metrics, complete with percentage-change indicators when date comparisons are active.
- Tables: Reserved for granular data analysis, allowing for detailed row-by-row inspection.
- Line Charts: These serve as the backbone for trend analysis, offering the ability to toggle between daily, weekly, and monthly views to identify long-term patterns.
- Bar Charts: Essential for comparative analysis, enabling users to contrast performance across different segments, channels, or geographic regions.
- Donut Charts: Used primarily for visual breakdowns, such as traffic source distribution or device category usage.
- Funnel Charts: A critical addition for monitoring conversion paths, allowing businesses to visualize where users drop off in the purchase or signup process.
These visualizations are not merely static images; they are interactive elements that allow for a deeper level of oversight. By hosting these within a centralized dashboard, businesses can eliminate the need to switch between tabs, creating a "single source of truth" for daily operations.
Deployment and Governance
The deployment of Dashboards is managed through a clear governance structure. To ensure data integrity and organizational focus, only users with Editor or Administrator permissions are authorized to create and publish these dashboards. Once an administrator publishes a dashboard, it becomes available in the Reports left-hand navigation, accessible to any user with viewing rights to that specific Google Analytics property.
This system is designed to facilitate collaboration. By sharing dashboards across an entire property rather than restricting them to individual user profiles, Google ensures that stakeholders—ranging from marketing teams to executive leadership—are viewing consistent data.

However, there are technical limitations that early adopters must consider. Standard Google Analytics properties are capped at 15 cards per dashboard, while premium properties are afforded up to 30. Furthermore, at this initial stage, the platform does not support API integration, advanced segments, or card-level comparisons, which may necessitate continued use of more robust tools like Looker Studio for highly complex, enterprise-grade data modeling.
Contextualizing the Shift in Data Strategy
The release of Dashboards comes at a time when data fatigue is a growing concern for marketing departments. As the volume of data generated by digital touchpoints continues to explode, the ability to synthesize information quickly has become a competitive advantage.
Historically, Google Analytics (particularly the transition from Universal Analytics to GA4) was criticized by some power users for its lack of flexibility in reporting compared to the older, more customizable custom dashboard features of the past. By reintroducing this functionality, Google is acknowledging a core requirement of the modern digital landscape: the need for speed and clarity.
Industry analysts suggest that this move is a strategic effort to keep users within the Google ecosystem. By enhancing the native reporting capabilities of GA4, Google reduces the incentive for businesses to export raw data to third-party business intelligence (BI) tools for simple visualization tasks. This shift aligns with Google’s ongoing mission to provide an all-in-one analytics solution that serves both the data scientist and the busy marketing manager.
The Impact on Daily Operations
For the average digital team, the implications of this release are profound. In many organizations, routine reporting is a time-consuming task. Analysts often spend hours each week manually pulling data into spreadsheets or secondary presentation tools to update stakeholders.
With the new Dashboard feature, this process can be automated. A manager can set up a dashboard that tracks weekly organic traffic, conversion rates, and bounce rates for key landing pages, and that dashboard remains updated in real-time. When a stakeholder asks for an update, the manager can direct them to a link within the GA4 interface rather than sending a static file.
Furthermore, by publishing directly to the Reports navigation menu, these dashboards become a permanent fixture of the reporting suite. This reduces the cognitive load on team members who previously had to remember where specific, scattered custom reports were saved in the library.

Challenges and Future Considerations
While the launch of Dashboards is a welcomed development, it is important to view it as a foundational release. The lack of current API support suggests that this tool is intended for internal, native reporting rather than for generating external client-facing reports or integrating with automated notification systems.
Organizations that require complex cross-platform data blending—such as combining CRM data with web analytics—will likely continue to use Looker Studio or other specialized BI platforms. However, for 90% of standard reporting needs, the native GA4 dashboard functionality is a significant leap forward in efficiency.
Looking ahead, industry experts anticipate that Google will likely expand these capabilities. Potential updates could include:
- Increased Card Limits: As businesses scale, the demand for more than 30 cards per dashboard will likely increase.
- Advanced Segmenting: The integration of advanced segments would allow for more nuanced performance analysis, such as comparing the behavior of high-value customers against first-time visitors.
- Cross-Property Reporting: Enabling the aggregation of data from multiple properties into a single dashboard view would be a major value-add for agencies and holding companies managing multiple brands.
Conclusion
Google Analytics Dashboards represent a strategic pivot toward user-centric design in data visualization. By lowering the barrier to entry for creating high-level, actionable reports, Google is helping businesses focus on what truly matters: the insights buried within their data.
While the feature is currently limited by card caps and the absence of certain advanced features, its integration into the core GA4 workflow provides an immediate improvement for teams looking to streamline their daily reporting routines. For businesses aiming to foster a culture of data-driven decision-making, the ability to quickly visualize and share KPIs is a crucial step toward achieving operational agility in an increasingly complex digital market. As teams begin to adopt these tools, the focus will shift from the mechanics of data retrieval to the actual strategy of performance optimization.