Mastering X Analytics: A Comprehensive Guide to Performance Measurement and Strategic Growth

The digital landscape for social media platforms remains in a state of constant flux, yet X—formerly known as Twitter—retains a unique position in the public discourse. While the platform has undergone significant structural and operational changes since its rebranding in 2023, it continues to serve as a primary hub for real-time information and community interaction. For content creators, businesses, and digital marketers, understanding the efficacy of their communication on X is no longer merely a hobbyist’s pursuit; it is a fundamental requirement for maintaining an effective social media strategy.
To optimize performance, users must move beyond anecdotal evidence and surface-level vanity metrics. True insight is derived from identifying longitudinal patterns: which content formats generate the highest reach, which topics stimulate meaningful dialogue, and which specific actions correlate with an increase in follower acquisition. This guide examines the mechanics of X’s native analytics, the limitations of its tiered subscription model, and how third-party tools like Buffer provide an alternative for data-driven decision-making.
The Evolution of X Analytics and Data Access
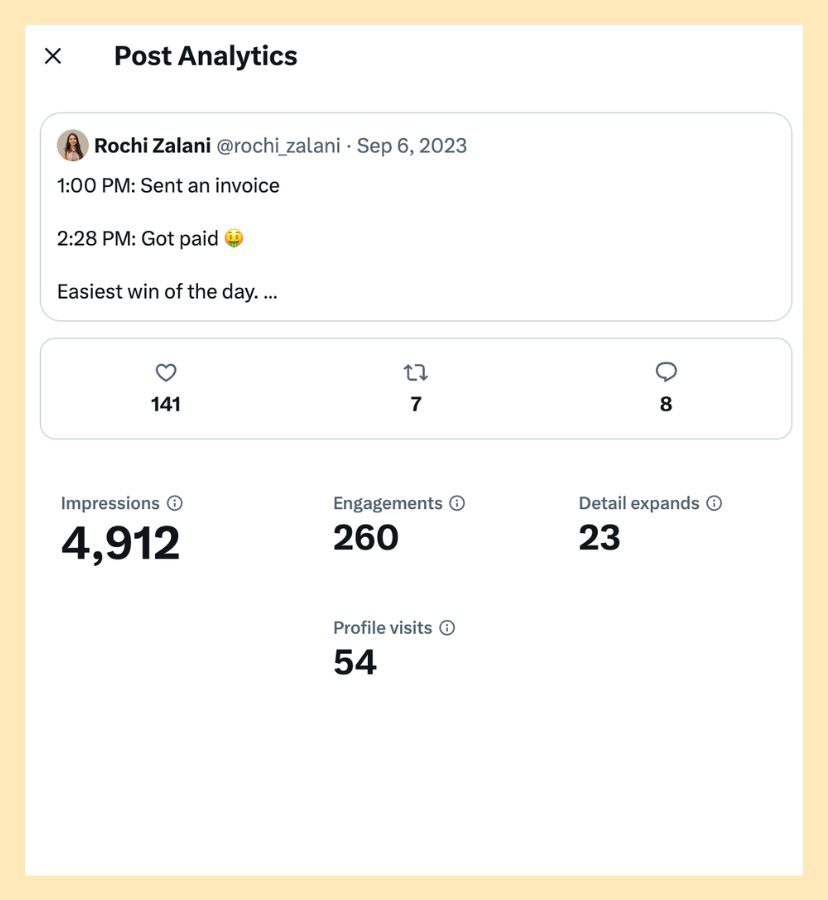
X analytics acts as the platform’s internal reporting mechanism, documenting account and post performance. At its core, the system tracks two distinct tiers of data: post-level engagement and account-level trends. Post-level metrics—including impressions, engagements, profile visits, and link clicks—are foundational indicators of content reach and relevance. Account-level data, which includes demographic insights, engagement rates over time, and audience activity patterns, provides the macro view necessary for long-term strategic planning.
The current data landscape on X is defined by a strategic shift toward a subscription-based model. Under the X Premium tier, subscribers gain access to a comprehensive dashboard that includes audience demographics, such as age, geographic location, and device usage. However, for the majority of the platform’s user base—which according to various market estimates, including SpaceX’s 2026 financial disclosures, exceeds 550 million monthly active users—access to these advanced insights remains restricted. With only a small fraction of the total user base opting for paid subscriptions, many users are left with limited visibility into their long-term growth trends unless they leverage external analytics integrations.
Navigating Native X Analytics: A Functional Breakdown
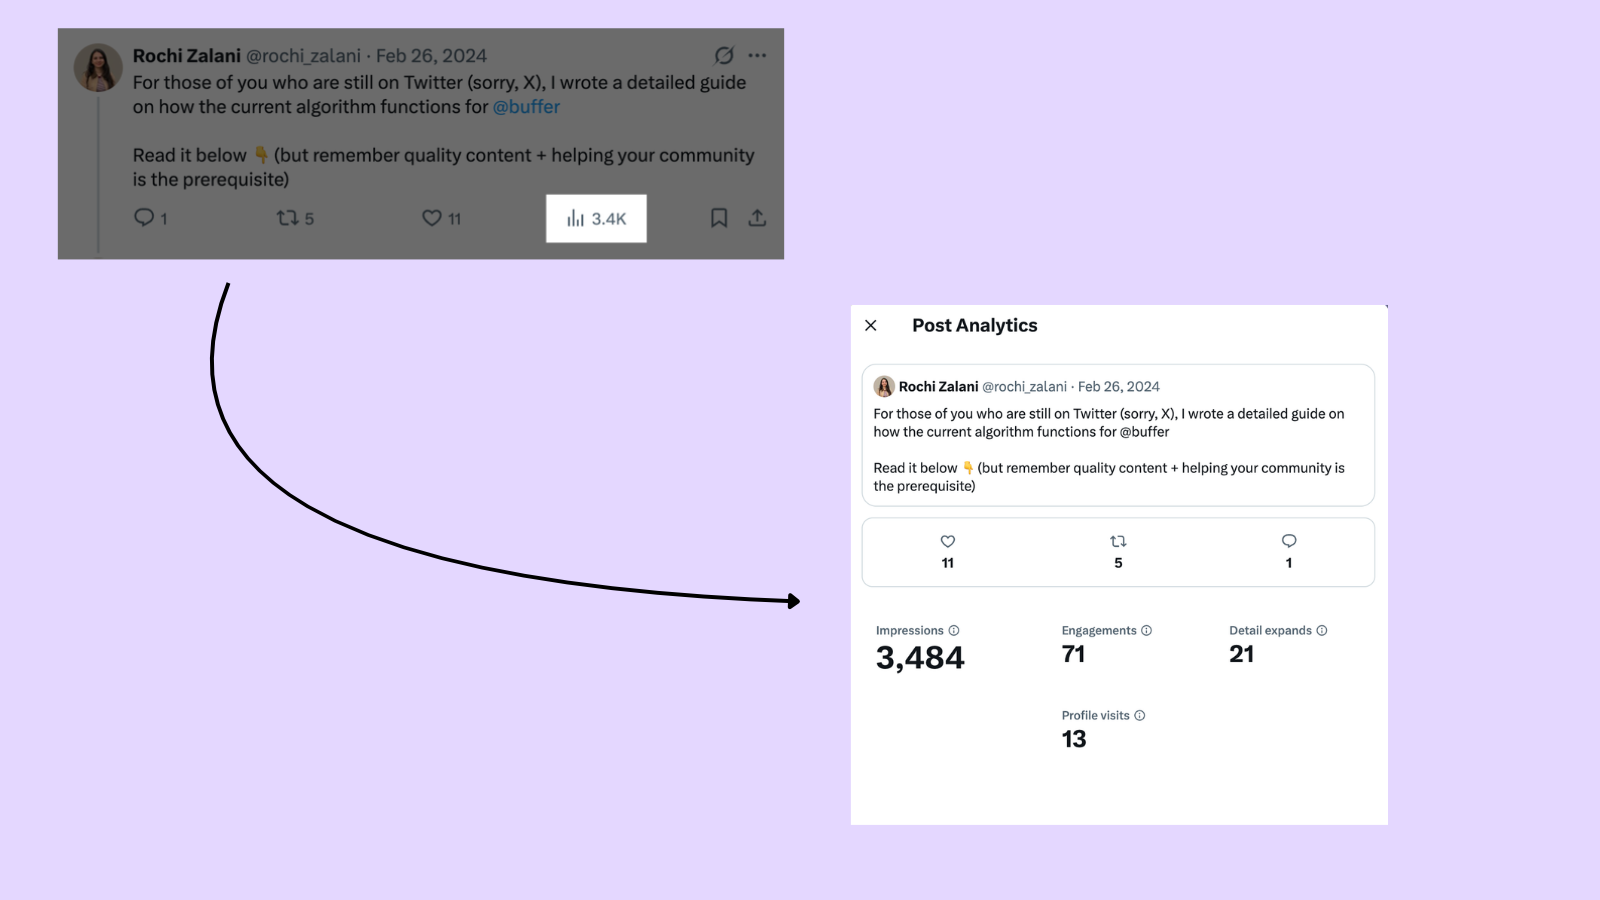
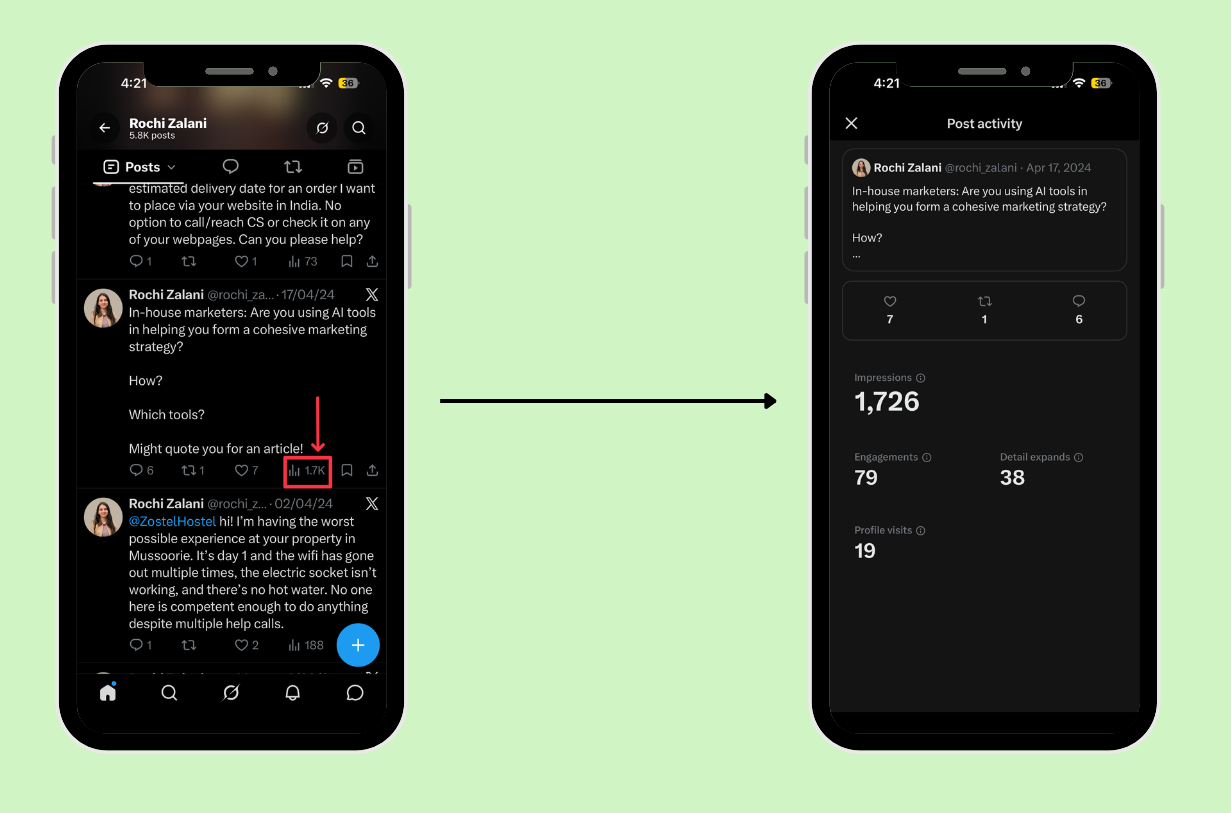
For users utilizing the free version of X, the primary mechanism for gauging performance is the post-level analytics icon, represented by a small bar chart beneath each entry. Clicking this icon opens an "Activity" window, which displays raw data regarding impressions and engagement. While this is efficient for evaluating the performance of an individual post, it lacks the aggregation capabilities required to identify broader trends.
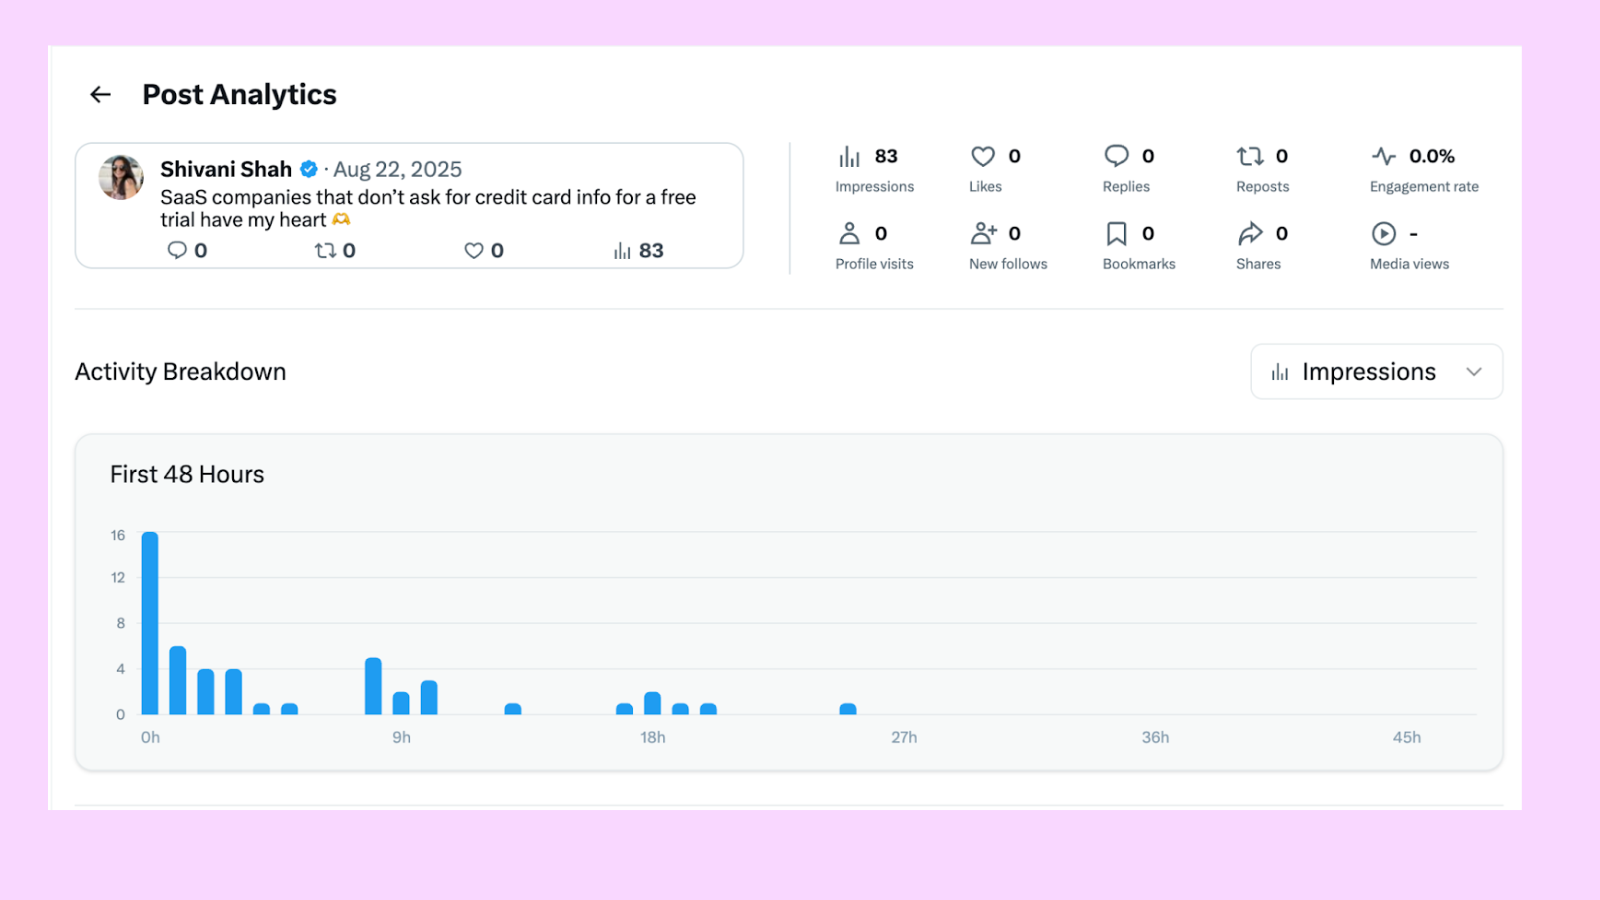
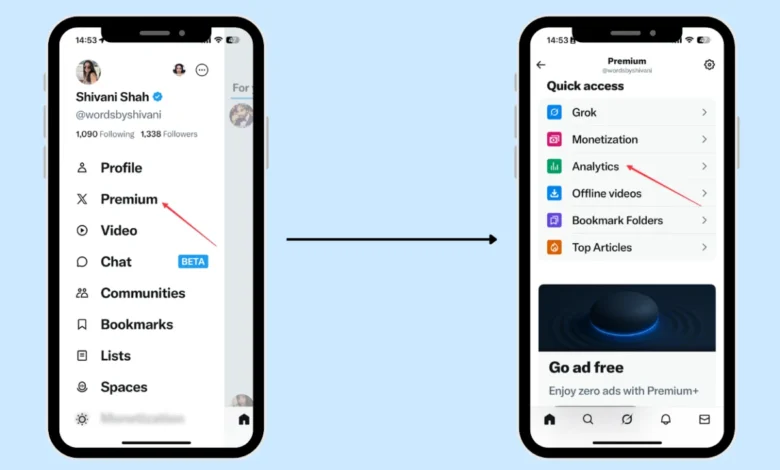
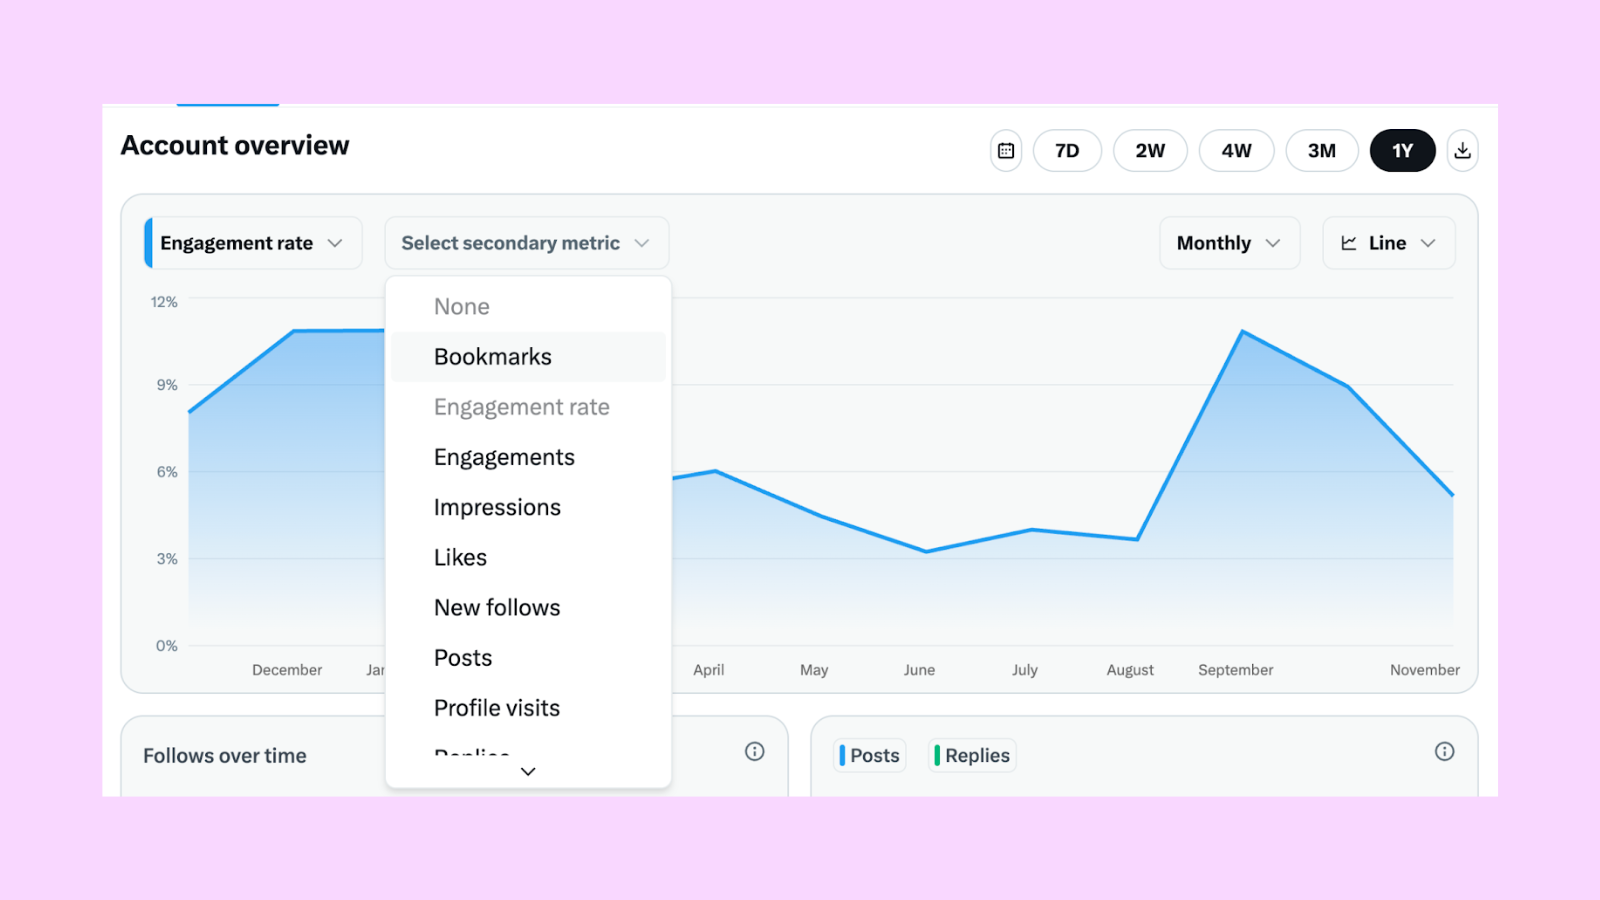
Conversely, X Premium users can access a more robust suite of tools via the dedicated analytics portal. This interface allows for:
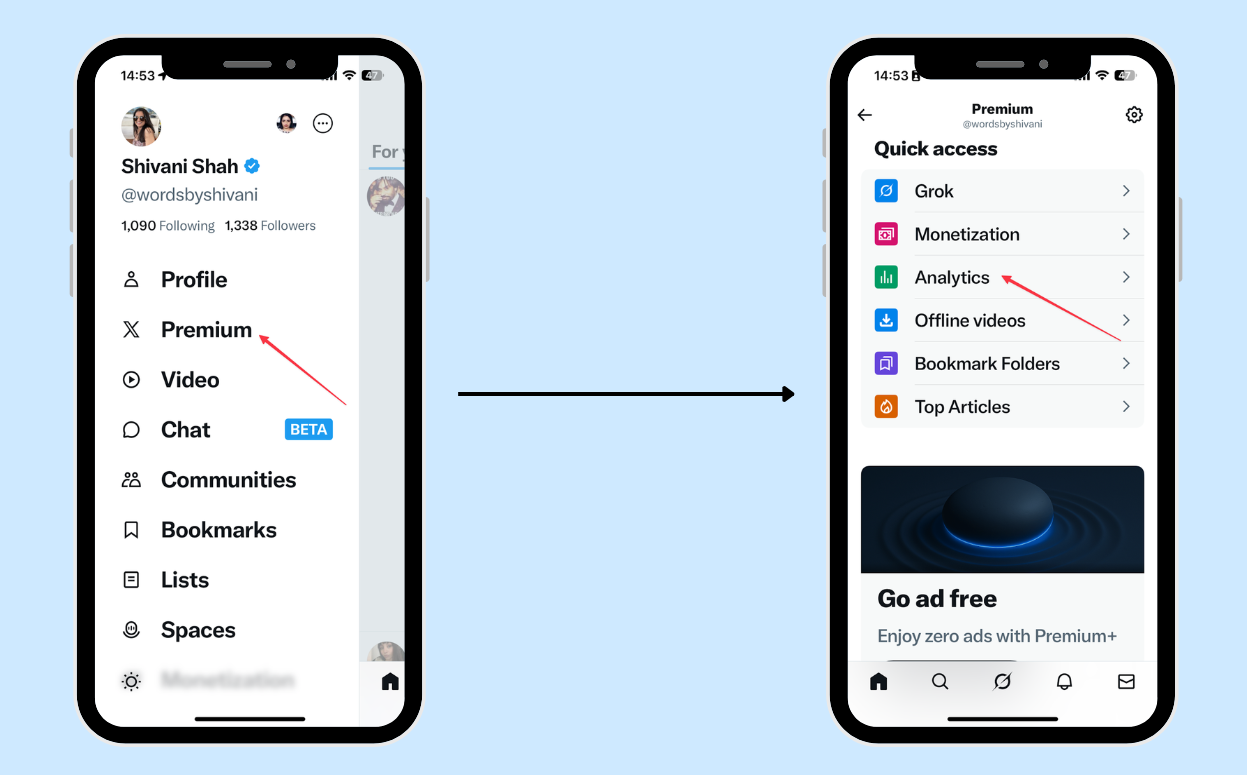
- Account Overview: A summary of key metrics over selected timeframes.
- Content Performance: A granular breakdown of individual post data, exportable via CSV files for further analysis.
- Audience Demographics: Insights into follower profiles, providing data on location, interests, and active hours.
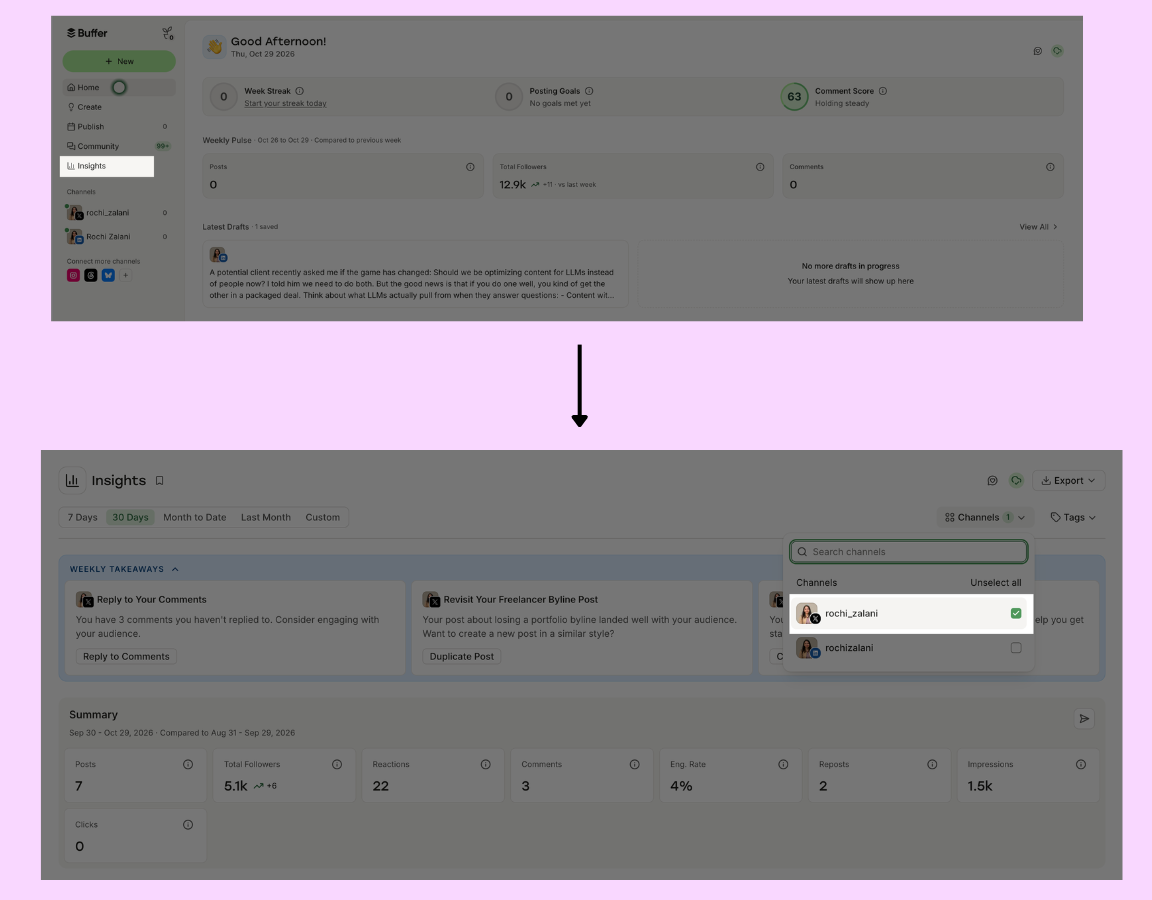
The transition to a paid model has necessitated a shift in how professional organizations approach their data. Because X restricts account-level reporting for free accounts, many social media managers have turned to third-party tools like Buffer to bridge the gap. These tools allow for the consolidation of data across multiple social platforms, enabling a holistic view of a digital presence that is often impossible to achieve using native platform tools alone.
Data-Driven Strategies for Growth
Understanding the numbers is only the first step. To effectively utilize X analytics, users must correlate specific metrics with strategic objectives.
1. Leveraging Impressions as a Reach Indicator
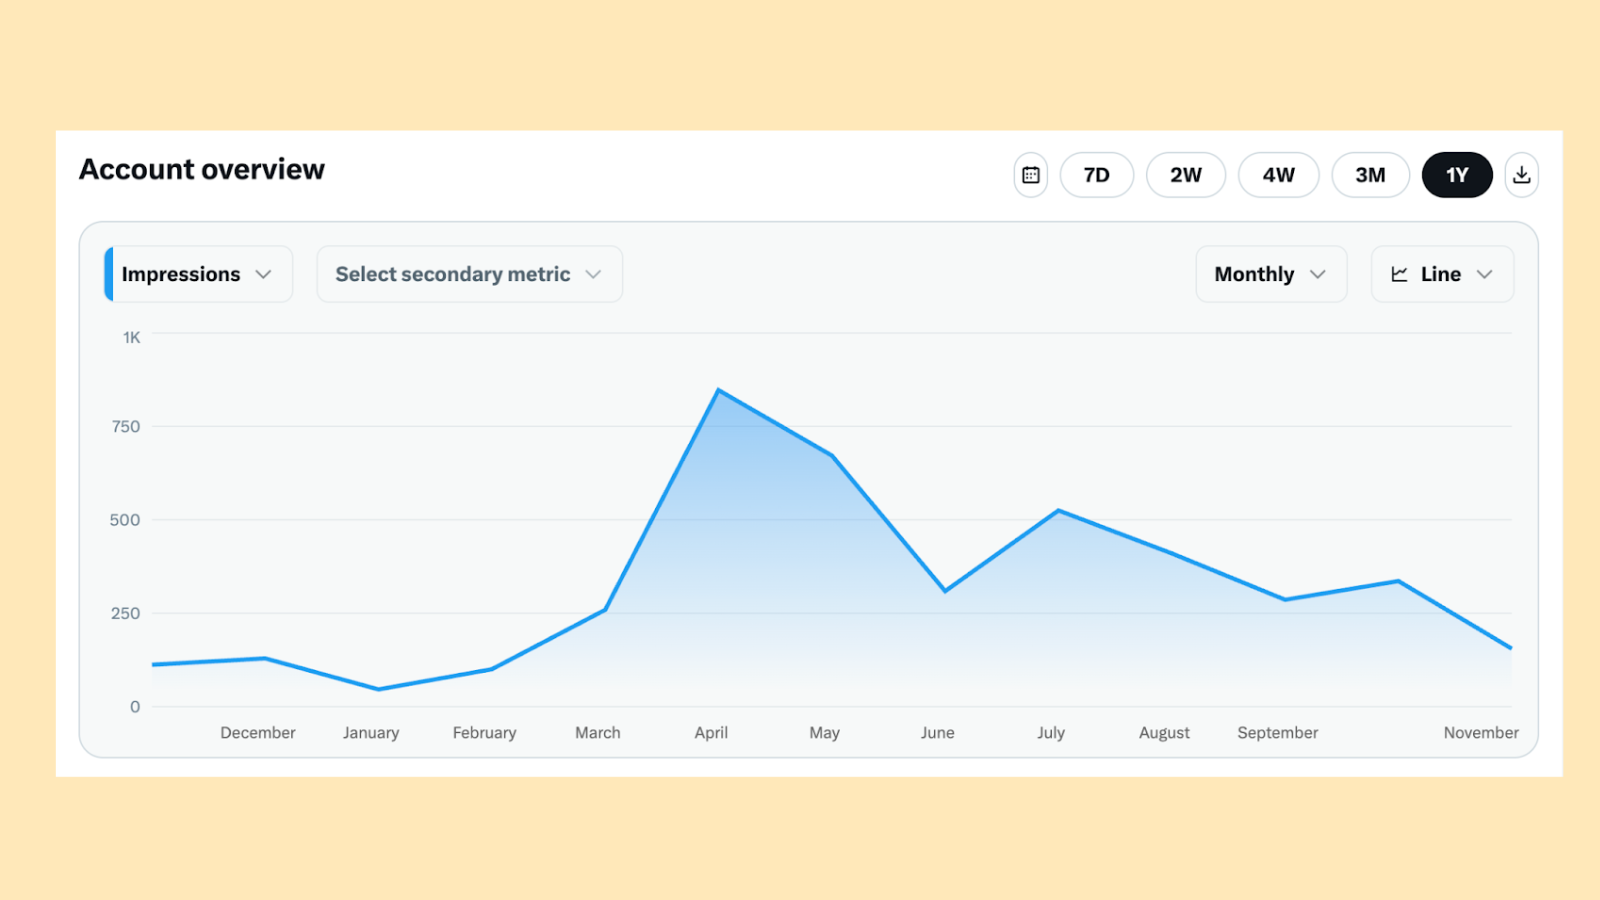
Impressions measure the total number of times a post has been displayed in a feed or search result. A sudden spike in impressions is often indicative of high-performing content that has triggered the platform’s algorithm. By analyzing these spikes, creators can identify which topics, hashtags, or media types (such as video versus static text) consistently command higher visibility. The key is to look for performance consistency rather than singular, anomalous viral hits.
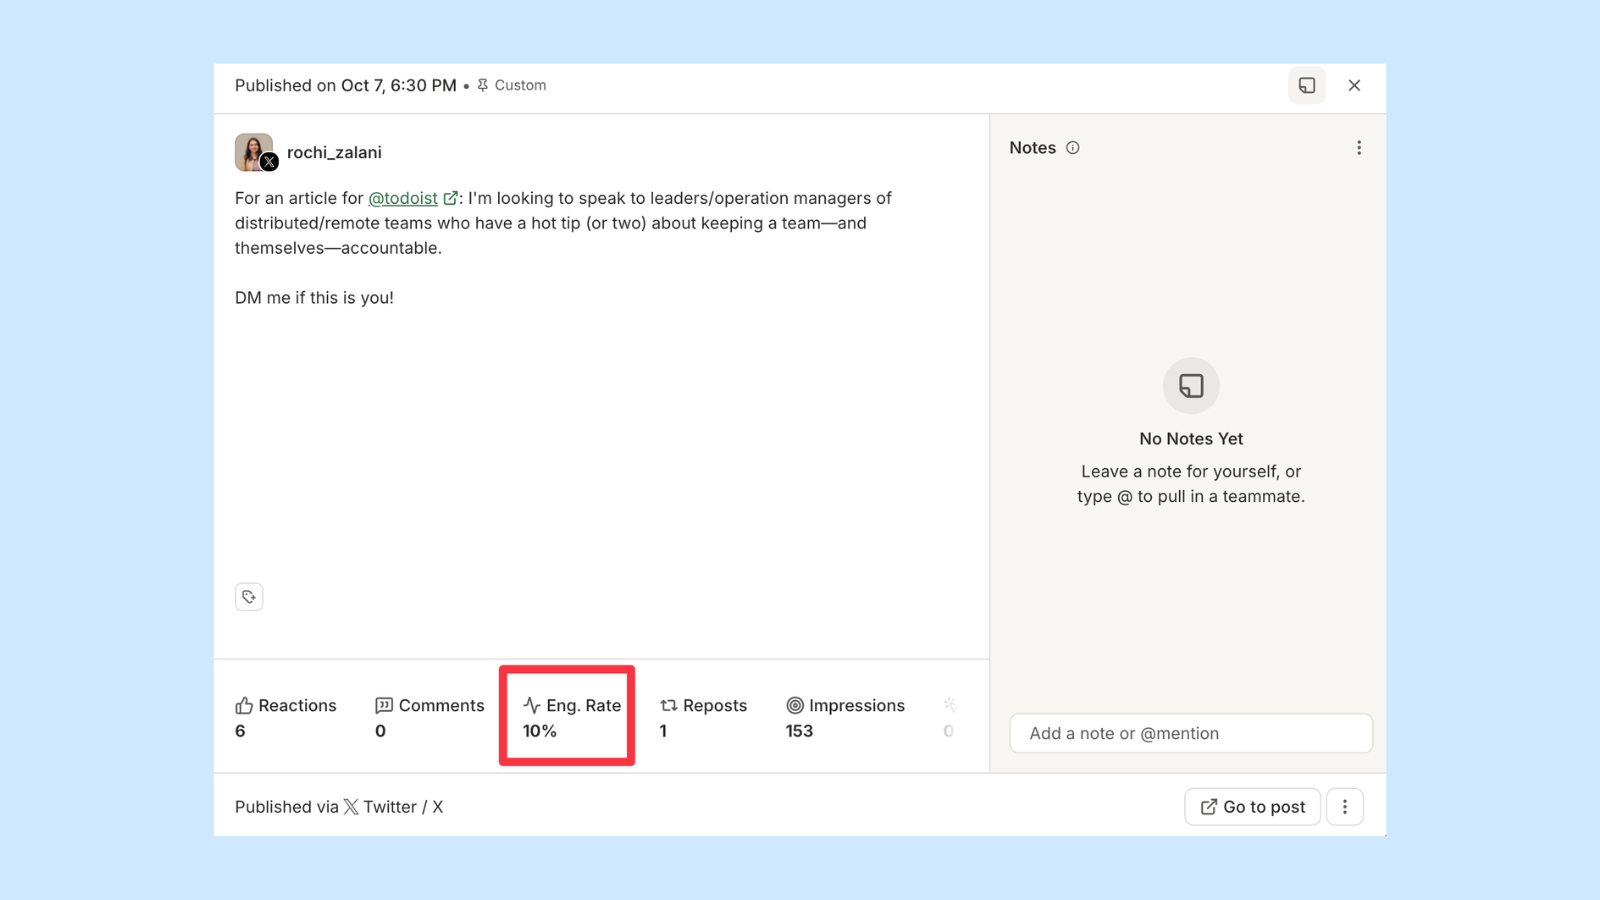
2. Engagement Rate: The Gold Standard of Relevance
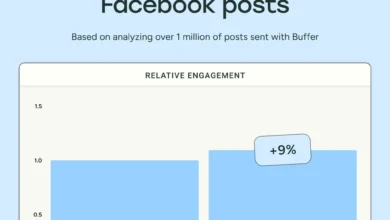
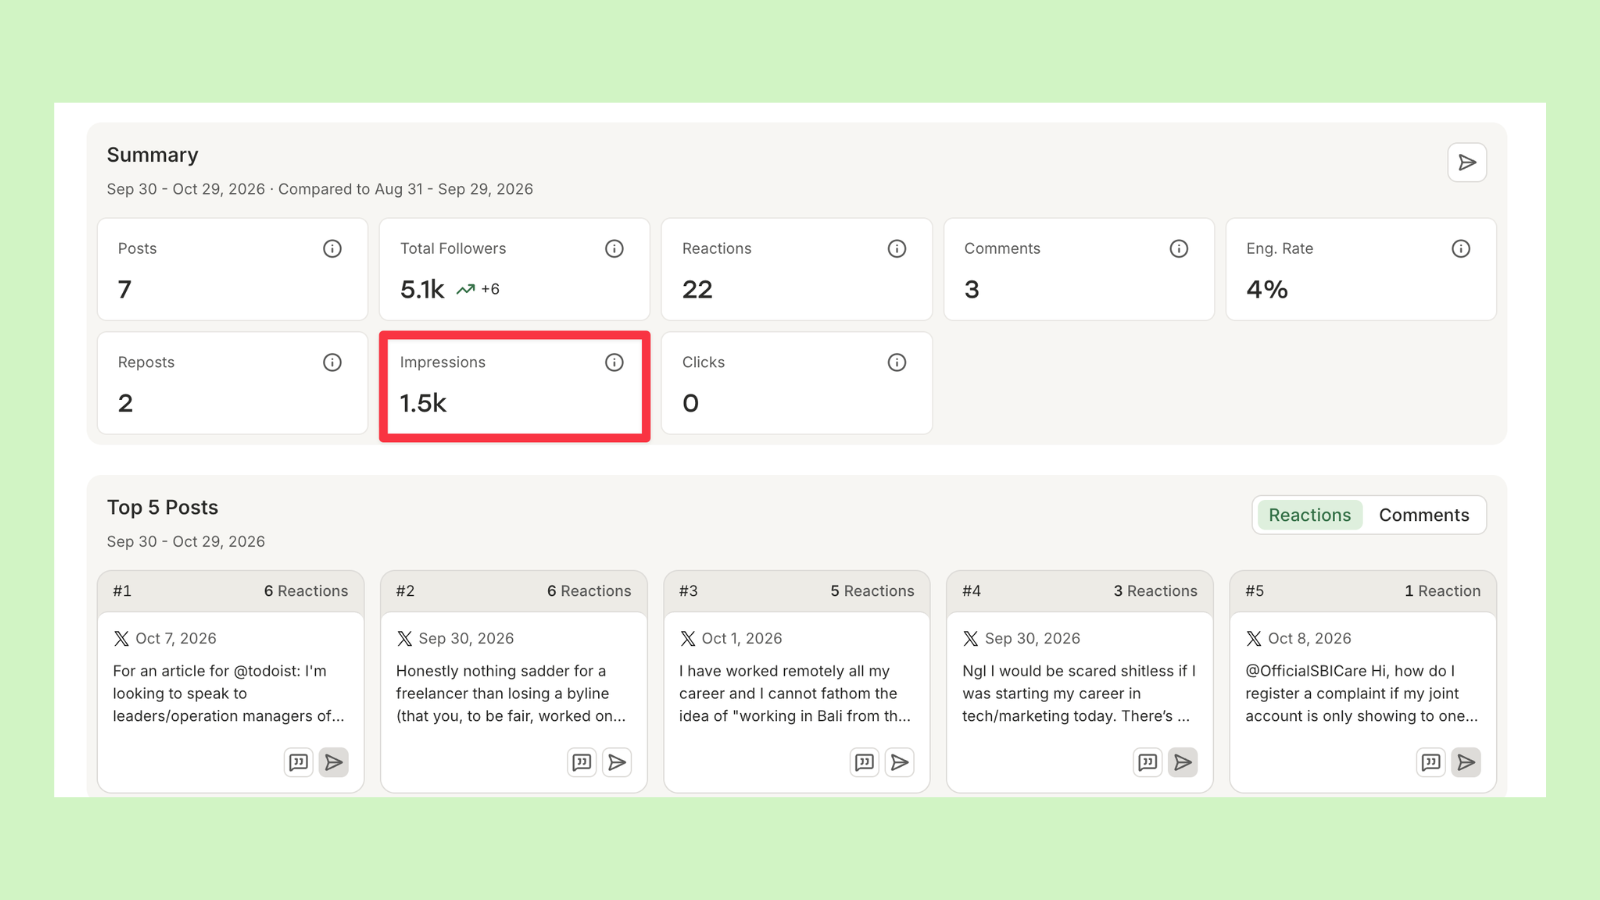
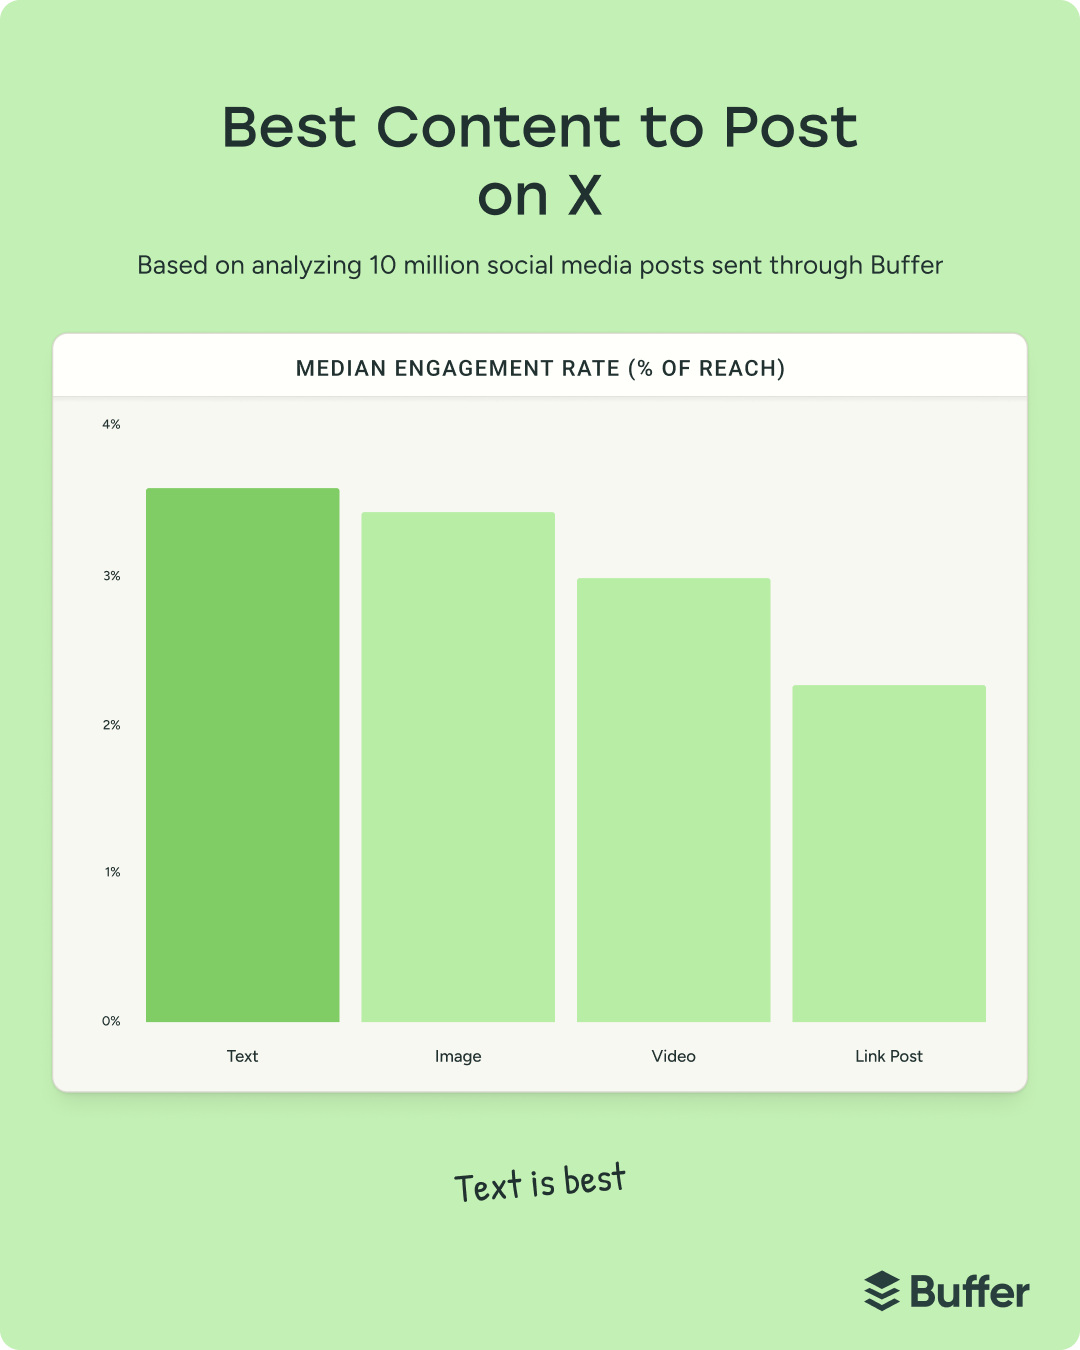
Engagement rate is calculated by dividing total interactions (likes, replies, reposts, clicks) by the total number of impressions. A high engagement rate signifies that the content provided value, compelling the viewer to stop scrolling. Recent data from social media benchmarks suggests that text-based posts often achieve higher median engagement rates than link-heavy posts. This finding serves as a critical indicator for content strategy: if your data confirms this trend, it may be time to pivot away from link-heavy promotion toward more conversational, value-driven content.
3. Analyzing Engagement Over Time
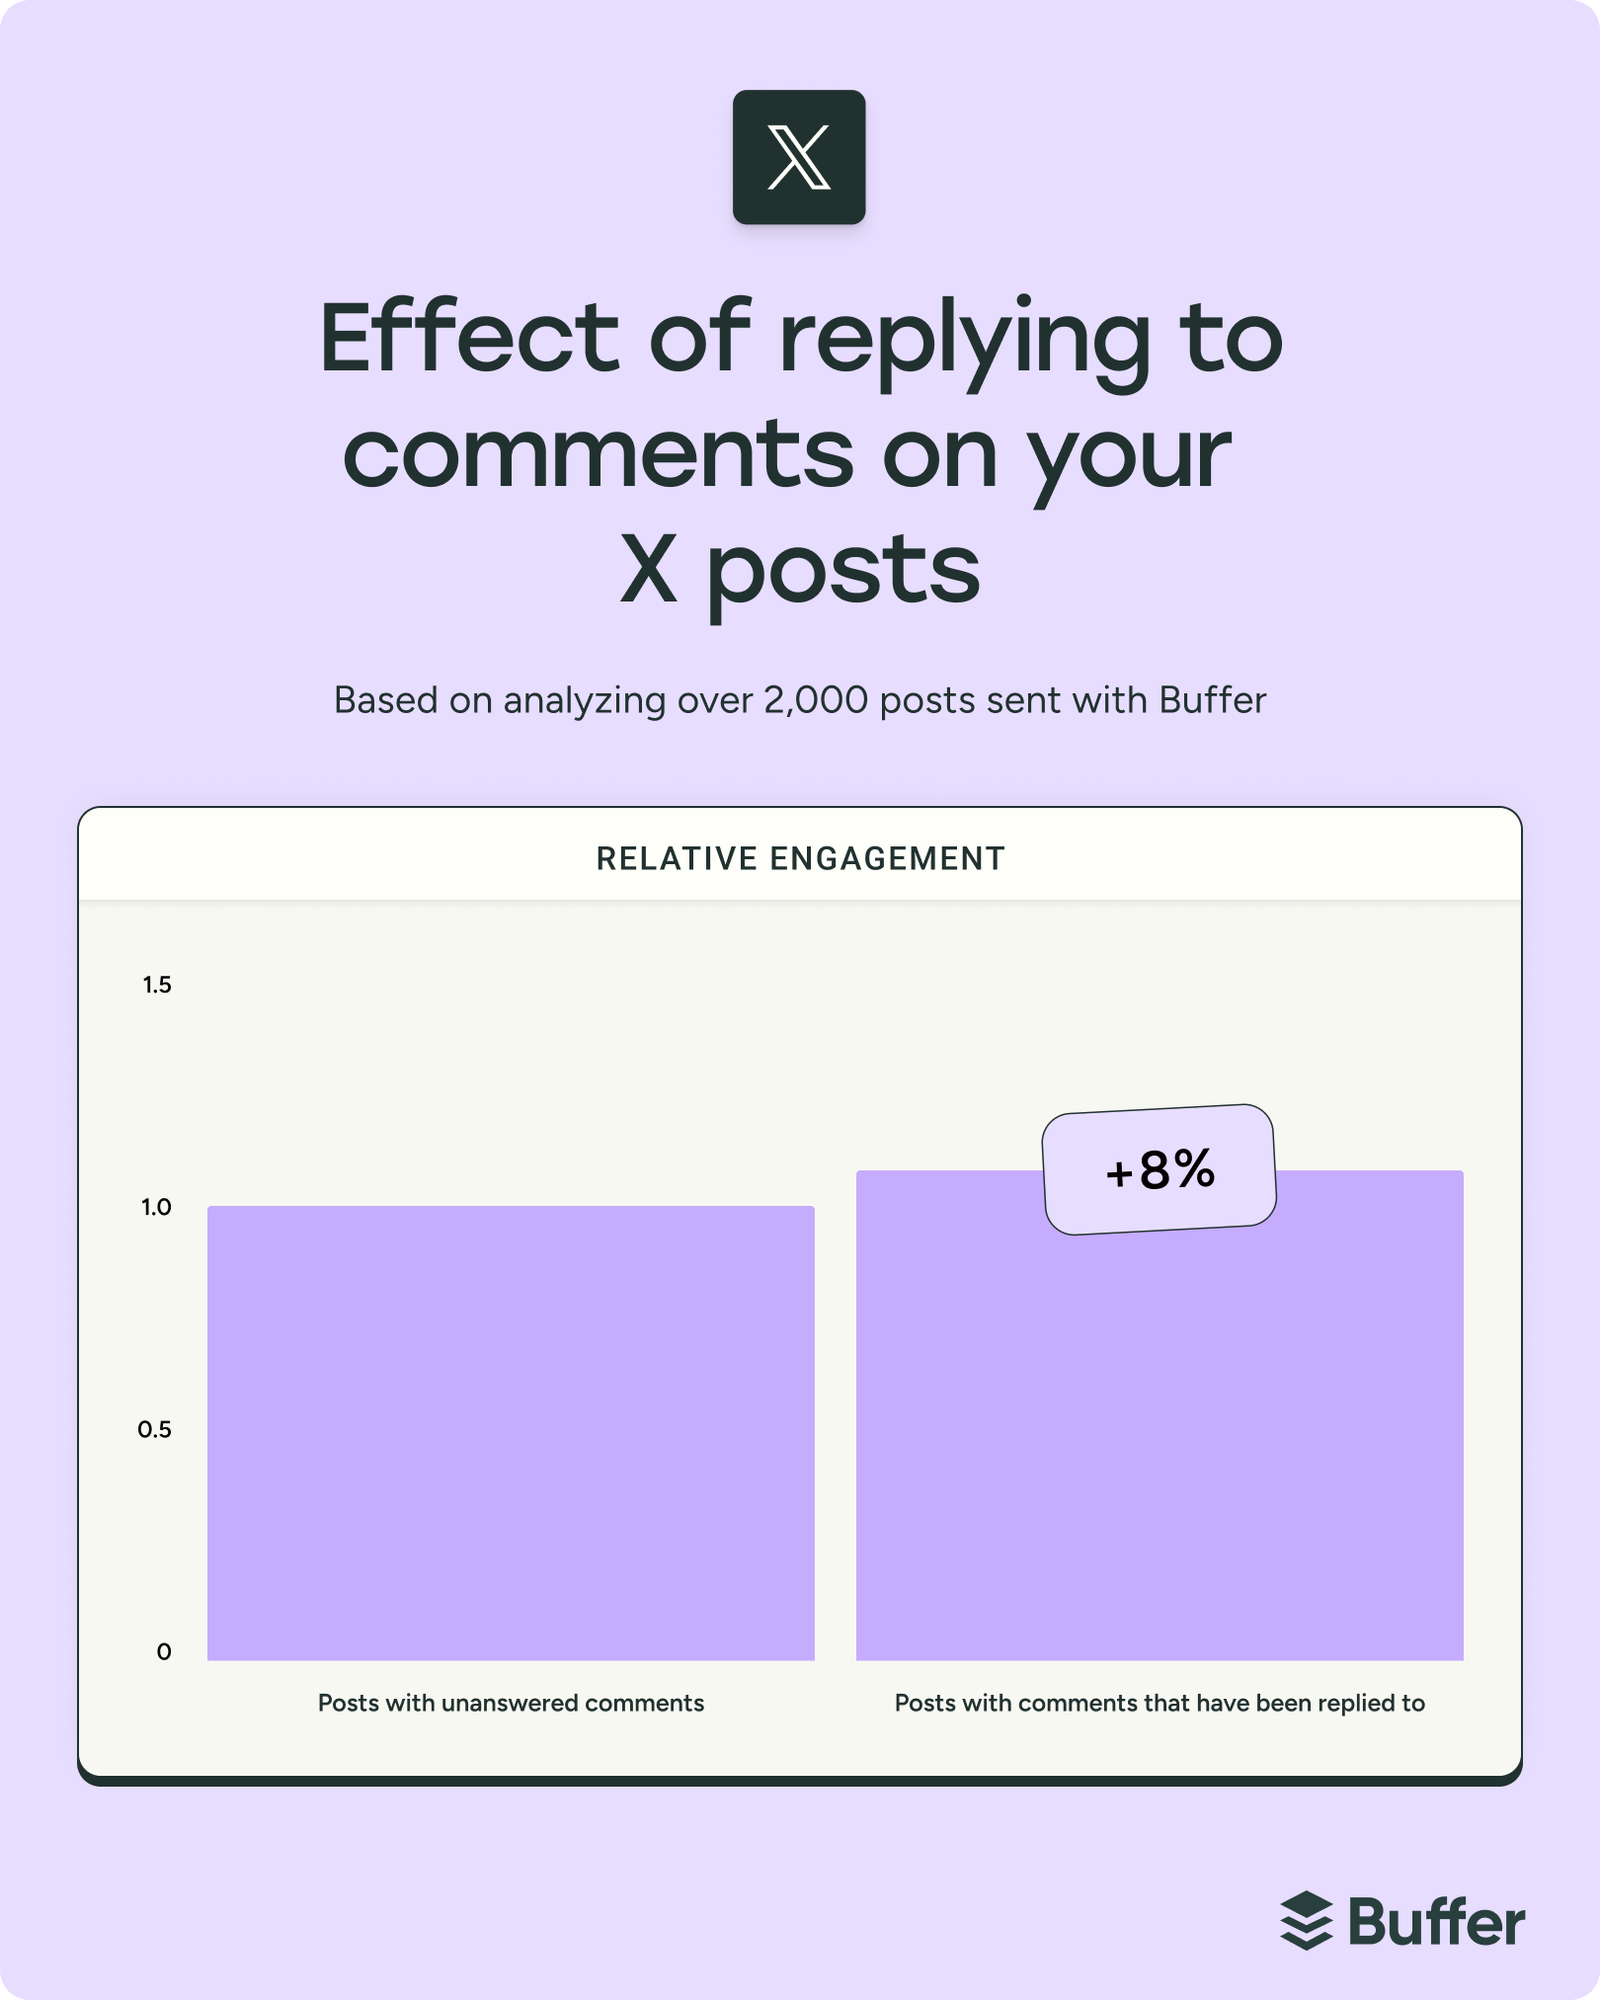
One week of high engagement does not signify a successful strategy; a multi-month trend does. By tracking the growth of replies and the sentiment of those replies, users can gauge the success of their community-building efforts. Furthermore, research indicates that active participation—specifically when a creator replies to comments—can boost engagement rates by approximately 8% compared to posts where comments go unaddressed.
4. Benchmarking Against Industry Standards
Comparing internal performance against industry benchmarks is essential for context. While X’s volatility makes precise benchmarking difficult, a general baseline engagement rate of 2.8% serves as a useful yardstick. If an account consistently performs above this median, the current strategy is likely sound. If performance lags, it is a signal to re-evaluate posting frequency, tone, and visual presentation.
The Role of External Management Tools
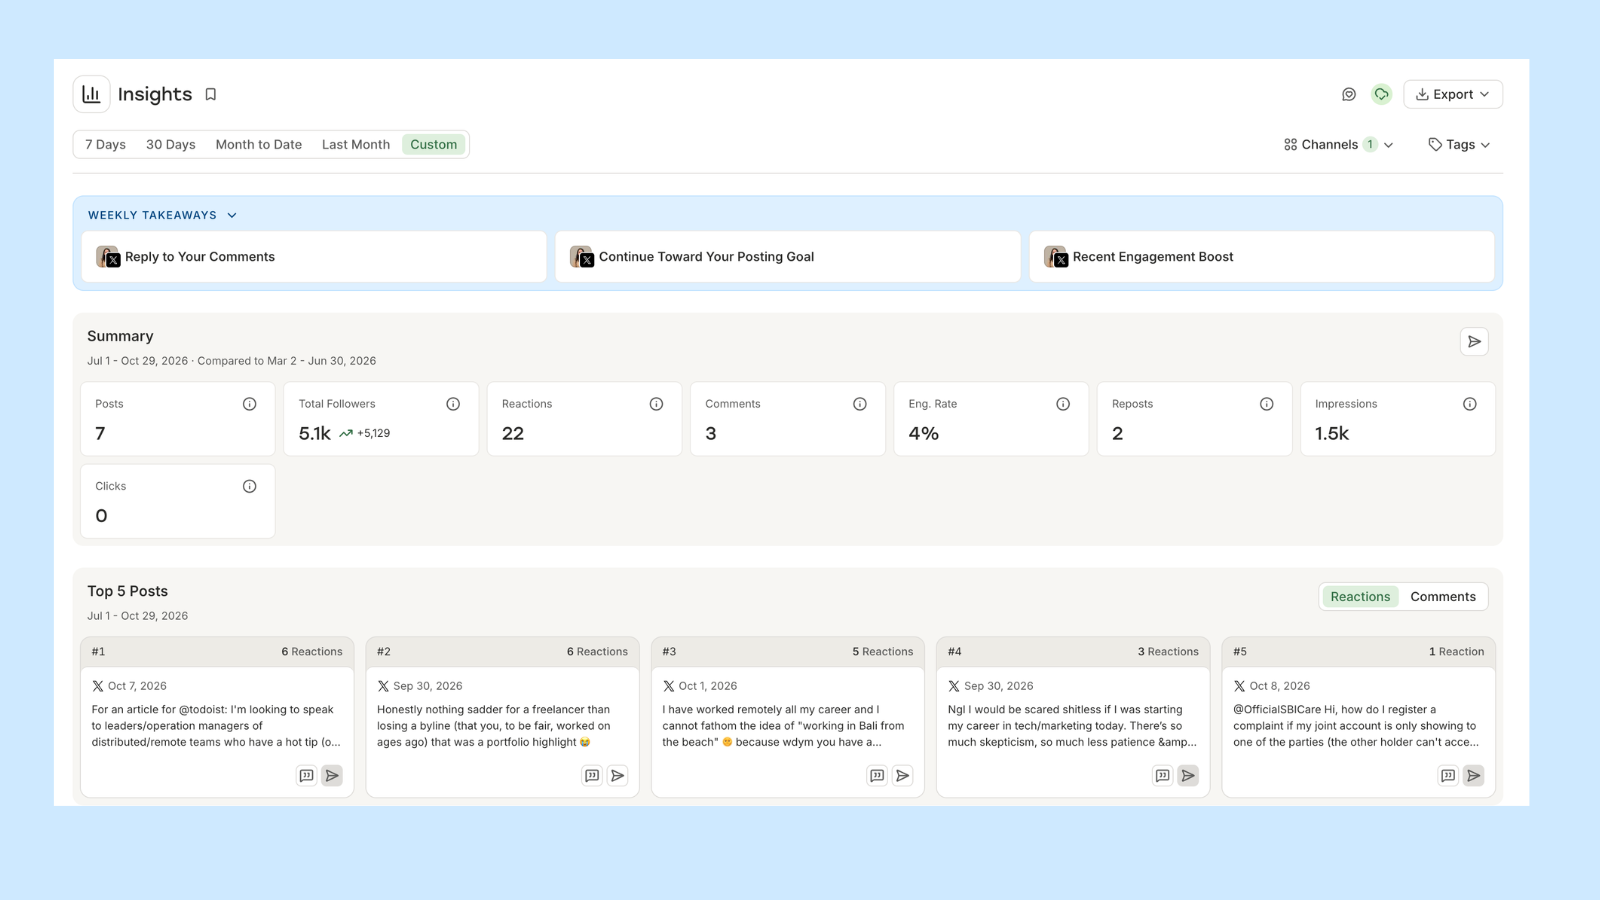
The necessity for third-party tools such as Buffer is driven by the demand for efficiency and cross-platform synergy. While native X analytics are sufficient for simple, single-platform monitoring, professional environments require integrated dashboards that pull data from various sources.
The advantages of using third-party analytics include:

- Cross-Channel Comparison: Viewing X performance alongside LinkedIn or Instagram allows for a unified social media strategy, ensuring consistency in brand messaging.
- Automated Insights: Rather than manually exporting CSV files and performing spreadsheet calculations, modern analytics platforms provide automated "takeaways," which highlight patterns and suggest actionable improvements.
- Report Generation: For agencies and social media managers, the ability to generate branded, professional PDFs directly from an analytics dashboard is a significant time-saver compared to building reports manually from native data exports.
Implications for Future Strategy
The current ecosystem of X analytics demonstrates a clear shift toward monetizing data. As the platform continues to refine its subscription offerings, the gap between "free" and "premium" data visibility will likely persist. For the average user, this implies a need for a more disciplined approach to tracking.
Regardless of the tools used, the objective remains the same: to minimize the time spent on data collection and maximize the time spent on content iteration. Success on X is rarely the result of a single brilliant idea; it is the product of consistent measurement, informed adjustment, and a deep understanding of audience behavior.
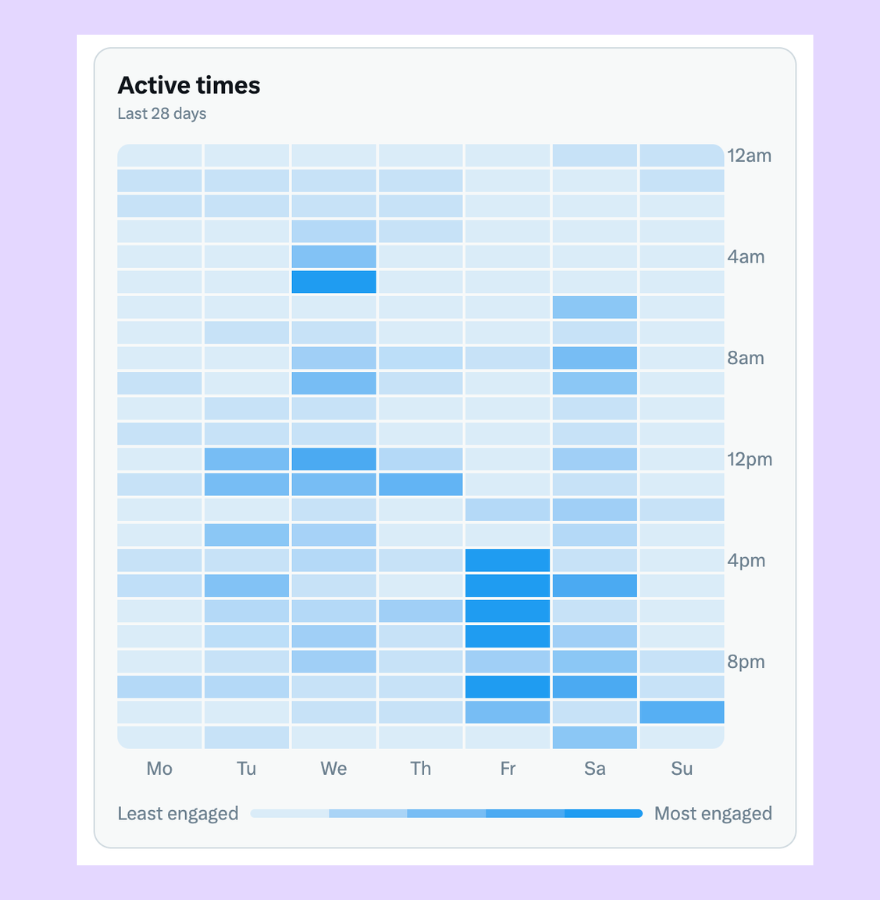
By regularly reviewing follower growth alongside engagement patterns, users can identify the "content pillars" that resonate most deeply with their audience. If a specific campaign results in an influx of new followers, that campaign should be analyzed for its specific characteristics—its tone, its timing, and its visual components—and then integrated into the standard content calendar.

In conclusion, X analytics is more than a list of numbers; it is a feedback loop. Whether one chooses the native path via X Premium or the integrated path via third-party software, the fundamental goal is to turn historical data into future performance. Those who prioritize this analytical rigor will inevitably find themselves better positioned to navigate the complexities of an evolving digital landscape.